Subsection 5.1.1 Basic Probability
We will start by defining some important terminology.
Terminology.
- Experiment
An experiment is a repeatable procedure or test being done. Common examples are flipping a coin, rolling a pair of dice, drawing a playing card from a deck, or taking a COVID test.
- Outcome
An outcome is one possible result of an experiment. When drawing a playing card from a deck, one possible outcome is drawing the Queen of Spades. Another outcome is drawing the Two of Diamonds.
- Event
An event is a particular outcome or set of outcomes. When rolling a pair of dice, one event is rolling "doubles", meaning that the same value is shown on both dice. (There are six different outcomes that make up this event.) Another event could be rolling a total of two.
- Sample Space
The sample space of an experiment is the set of all possible outcomes. When flipping a coin, the sample space consists of the two possible outcomes: Heads and Tails. We would write that as \(S=\lbrace H,T \rbrace\text{.}\)
- Probability
The probability of an event is the likelihood that it will occur, usually expressed as a fraction, decimal, or percentage. When flipping a coin, the probability of flipping heads is 50%.
While probability theory has far-reaching applications in such fields as medicine, business, politics, and science, we will focus mostly on applications in games and gambling because less background knowledge is required to understand them. In particular, we will take many examples from games involving cards, spinners, and dice.
Consider the experiment of flipping a coin three times. We can denote, for example, the outcome of getting heads on the first flip, tails on the second flip, and tails on the third flip as \(HTT\text{.}\) Using this notation, the sample space can be written as follows:
\begin{equation*}
S=\lbrace HHH{,}\, HHT{,}\, HTH{,}\, THH{,}\,HTT{,}\,THT{,}\,TTH{,}\,TTT\rbrace.
\end{equation*}
The event \(E\) of rolling at least two tails is \(E=\lbrace HTT{,}\,THT{,}\,TTH{,}\,TTT\rbrace\text{.}\)
There are four outcomes in which we get at least two tails out of the total of eight possible outcomes. Assuming it is a fair coin, meaning that all of the outcomes are equally likely, then the probability of the event \(E\text{,}\) which we write using function notation \(P(E)\) is:
\begin{equation*}
P(E)=\frac{4}{8}=\frac{1}{2}.
\end{equation*}
Example 5.1.2.
Consider the experiment: rolling a single standard six-sided die. (Die the singular of dice, so we can have one die or two or more dice.)
What is the sample space, and how many outcomes are in the sample space?
What outcomes are in the event "rolling an odd number", and how many outcomes are in that event?
What is the probability of the event "rolling an odd number"?
Solution.
The sample space is
\begin{equation*}
S=\lbrace1{,}2{,}3{,}4{,}5{,}6\rbrace.
\end{equation*}
There are six outcomes in the sample space.
The event "rolling an odd number" is
\begin{equation*}
E=\lbrace 1{,}3 {,}5\rbrace.
\end{equation*}
There are three outcomes in event \(E\text{.}\)
The probability of rolling an odd number is
\begin{equation*}
P(E)=\frac{3}{6}=\frac{1}{2}.
\end{equation*}
Example 5.1.3.
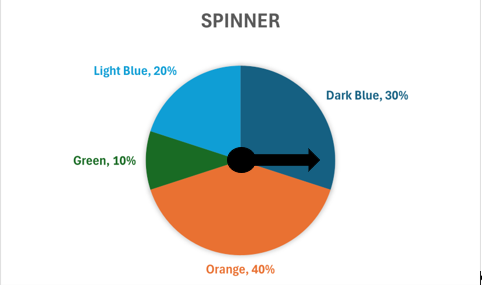
Consider a game involving the spinner below.
Find the probability of spinning dark blue or green.
Did you notice the difference between the coin and dice examples and the spinner example? Because the sizes of each color wedge in the spinner are different, they have different probabilities. However, provided the coins and dice are fair, there is an equally likely chance of each outcome. On average, we should flip heads half the time and tails the other half. When rolling a single die, we should roll each number approximately one sixth of the time.
When all outcomes are equally likely, probability can be calculated as the number of ways what you are looking for occurs divided by the total number of things that can occur. A more formal definition follows.
Probability Involving Equally-likely Outcomes.
If all outcomes are equally likely, the probability that event \(E\) occurs is equal to the proportion of outcomes in the sample space corresponding to event \(E\text{.}\)
\begin{equation*}
P(E)=\frac{\text{Number of outcomes corresponding to E}}{\text{Number of outcomes in the sample space}}
\end{equation*}
Example 5.1.4.
Let’s say you have a bag with 40 truffles, 28 dark chocolate and 14 milk chocolate. If you pick a truffle at random, what is the probability that it will be dark chocolate?
Solution.
Because we are picking a cherry at random, we may assume that all outcomes (truffles) are equally likely, so we may use the basic probability formula.
It isn’t necessary to write sets for the sample space and the event because we already know how many items are in each, although writing the sets would not be a problem.
The probability of picking a dark chocolate truffle is
\begin{equation*}
P(\text{dark chocolate})=\frac{\text{number of dark chocolate truffles}}{\text{total number of truffles}}=\frac{28}{40}
\end{equation*}
We can simplify to \(\frac{7}{10}\text{.}\) It would also be correct to express the probability as 0.7 or 70%.
What if someone asked you to find the probability of rolling a seven on a standard six-sided die? Since there isn’t a seven on a standard die, this event is impossible, so its probability is zero. Mathematically, that is \(P\left(\text{Rolling a 7}\right)=\frac{0}{6}=0.\)
On the other extreme, the probability of rolling a one, two, three, four, five, or six is \(P\left(1,2,3,4,5,\text{ or}6\right)=\frac{6}{6}=1\text{.}\) In words, there is a one hundred percent chance of rolling one of the six possible outcomes.
Probability of Impossible and Certain Events.
If an event is impossible, its probability is zero, and if an event is guaranteed, its probability is one or 100%.
\begin{align*}
P\left(\text{Something impossible}\right) \amp=0 \\
P\left(\text{Something certain}\right) \amp=1
\end{align*}
All other events have probabilities between zero and one.
\begin{equation*}
0\le P(E) \le 1.
\end{equation*}
If you obtain a probability that is negative or greater than one, check your work—there is a mistake somewhere.
Cards.
A standard American deck of playing cards consists of four suits (hearts, spades, diamonds and clubs). Spades and clubs are black; hearts and diamonds are red.
Each suit contains 13 cards, each of a different rank:
An Ace (A),which may be considered a low card, a high card, or both, depending on the game,
One each of cards numbered two through ten,
A Jack (J),
A Queen (Q), and
A King (K).
Jacks, queens, and kings are considered face cards, and jacks, queens, kings, and aces are considered picture cards.
There are a total of 52 cards in the standard deck.
Some games make use of two extra cards, called jokers, which may be considered wild cards.
Example 5.1.5.
Find the probability of getting an ace when drawing a single card from a standard 52-card deck.
Solution.
There is one ace in each of the four suits, so there are four aces in the deck out of the 52 total cards. Therefore, the probability of drawing an ace is
\begin{equation*}
P(Ace)=\frac{4}{52}=\frac{1}{13}
\end{equation*}
Example 5.1.6.
Find the probability of getting a black face card when drawing a single card from a standard deck.
Solution.
There are three face cards of each suit, and two of the suits are black. So, there are six black face cards, and the probability of drawing one of them is
\begin{equation*}
P(\text{black face card})=\frac{6}{52}=\frac{3}{26}
\end{equation*}
or approximately 11.54%.
Dice.
Many board games use two dice, each with six sides. Each side has a different number of dots: one through six.
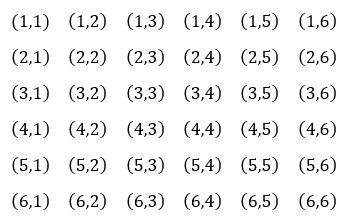
The sample space for the 36 possible outcomes of rolling two dice is shown in the grid below. In each ordered pair, the first component represents the number of dots shown on the first die and the second component represents the number of dots shown on the second die.
Example 5.1.7.
When rolling two dice, if both show the same number it is called "doubles". What is the probability of rolling doubles?
Solution.
There are six ways to roll doubles, \((1,1)\) through \((6,6)\text{,}\) out of the total of 36 possible outcomes. The probability is
\begin{equation*}
P\left(\text{doubles}\right)=\frac{6}{36}=\frac{1}{6}
\end{equation*}
Example 5.1.8.
What is the probability of getting a sum greater than eight when rolling two dice?
Solution.
There are four ways to obtain a sum of nine: \((6{,}3)\text{,}\) \((5{,}4)\text{,}\) \((4{,}5)\text{,}\) and \((3{,}6)\text{.}\)
There are three ways to obtain a sum of ten: \((6{,}4)\text{,}\) \((5{,}5)\text{,}\) and \((4{,}6)\text{.}\)
There are two ways to obtain a sum of eleven: \((6{,}5)\) and \((5{,}6)\text{.}\)
There is one way to obtain a sum of twelve, which is the greatest possible sum: \((6{,}6)\text{.}\)
(Did you notice that entries with the same sum are aligned along diagonals of the sample space grid?)
Altogether, there are 10 ways to obtain a sum greater than eight. Therefore, the probability of rolling a sum greater than eight is
\begin{equation*}
P(\text{sum}\gt 8)=\frac{10}{36}=\frac{5}{18}
\end{equation*}
or about 27.78%.
Subsection 5.1.2 Probability of "And" and "Or" Events
In mathematics, we use the words "and" and "or" in a very particular way.
"And".
Let \(A\) and \(B\) be two events. Then the event "\(A\) and \(B\)" is written \(A\cap B\text{.}\)
It is the intersection (or overlap) of \(A\) and \(B\text{,}\) meaning both must be true.
For example when rolling a single die, suppose \(A=\lbrace2{,}3{,}5 \rbrace\) is the event of rolling a prime number and \(B=\lbrace 1{,}3{,}5 \rbrace\) is the event of rolling an odd. Then
\begin{equation*}
A\cap B = \lbrace 3{,}5 \rbrace
\end{equation*}
is the event of rolling a number that is both prime and odd.
Or.
Let \(A\) and \(B\) be two events. Then the event "\(A\) or \(B\)" is written \(A\cup B\text{.}\)
It is the union (or compilation) of \(A\) and \(B\text{,}\) meaning either \(A\) or \(B\) or both must be true.
If \(A=\lbrace2{,}3{,}5 \rbrace\) is the event of rolling a prime number and \(B=\lbrace 1{,}3{,}5 \rbrace\) is the event of rolling an odd, then
\begin{equation*}
A\cup B = \lbrace 1{,} 2 {,} 3{,}5 \rbrace
\end{equation*}
is the event of rolling a number that is either prime or odd (or both).
Example 5.1.9.
In the experiment of drawing a single card from a standard deck, event \(A\) is "drawing a seven" and event \(B\) is "drawing a heart". How many elements are in the events \(A \cap B\) and \(A \cup B\text{?}\)
Solution.
Event \(A\ cap B\) consists of the sevens that are also hearts. There is only one seven of hearts, so there is one element in \(A\capB\text{.}\)
Event \(A \cup B\) consists of all the sevens and all the hearts. There are four sevens and 13 hearts, but we need to be careful not to count the seven of hearts twice.
We can say that there are four sevens, which includes the seven of hearts, and 12 additional hearts for a total of 16 elements in event \(\cup B\text{.}\)
To find the total number of cards that are sevens or hearts, we added the number of sevens plus the number of hearts that are not sevens. Another way to think about this is adding the number of sevens plus the number of hearts and subtracting the intersection which is one card: the seven of hearts. That would give us
\begin{equation*}
4+13-1=16
\end{equation*}
cards. In general, the number of outcomes in event \(A \cup B\) is equal to the number of outcomes in \(A\) plus the number of outcomes in \(B\) minus the number of outcomes in \(A \cap B\text{.}\)
we can generalize this approach to write a formula for the probability of an "or" event.
Probability of A or B.
We have two equivalent methods to calculate the probability of an "or" event:
\begin{equation*}
P(A \cup B)=\frac{\text{Number of outcomes corresponding to }A \cup B}{\text{Number of outcomes in the sample space}}
\end{equation*}
\begin{equation*}
P(A \cup B)=P(A)+P(B)-P(A \cap B)
\end{equation*}
Example 5.1.10.
An outreach program for STEM majors a college is open to female students and first-generation students, which are students who are the first in their families to go to college. If 53% of the students at the college are female, 38% of the students are first-generation, and 17% are female first-generation students, what percentage of students are eligible for the program?
Solution.
Let \(A\) be the event that a student is female and let \(B\) be the event that a student is a first-generation student.
We are given that \(P(A)=0.53\text{,}\) \(P(B)=0.38\text{,}\) and \(P(A \cap B)=0.17\)
We are looking for the percentage of students who are female or first-generation, or \(P(A \cup B)\text{,}\) which we can find using the formula.
\begin{align*}
P(A\cup B) \amp=P(A)+P(B)-P( A\cap B) \\
P(A \cup B) \amp=0.53+0.38-0.17 \\
P(A \cup B) \amp=0.74
\end{align*}
Therefore, 74% of students are eligible for the program.
Subsection 5.1.3 Contingency Tables
A contingency table summarizes all the possible combinations for two categorical variables. Each value in the table represents the number of times a particular combination of outcomes occurs. For example, suppose we randomly select 250 households from the greater Portland area and ask whether they have a cat and whether they have a dog. In this case, “have a cat” and “have a dog” are the two variables, and each variable has two categories: Yes and No. To create the contingency table, we make columns for the categories of one variable, and rows for the categories of the other variable. We also add a row and column for the subtotals of each category. Each cell of the resulting table contains the number of outcomes having the characteristics of the intersecting row and column categories. For our dog and cat example, the table would look like this:
| Cat |
Yes Cat and Yes Dog |
Yes Cat and No Dog |
Yes Cat Total |
| No Cat |
No Cat and Yes Dog |
No Cat and No Dog |
No Cat Total |
| Total |
Yes Dog Total |
No Dog Total |
Grand total |
Suppose that of the 250 households surveyed, 180 said they have a cat, 95 said they have a dog, and 52 said they have both a cat and a dog. We can use this information to fill in the cells of the table.
| Cat |
52 |
|
180 |
| No Cat |
|
|
|
| Total |
95 |
|
250 |
The first cell we can fill in is the grand total, which is the total number of subjects in the study. In this case, there are 250 households participating in the survey. The next two cells we can fill in are the total number of households that have a cat, 180, and the total number of households that have a dog, 95. The final cell we can fill in from the given information is the intersection of the having a dog column and a having a cat row, which is 52 households.
Since each row and column must sum to their totals, we can use subtraction to find the missing numbers as shown below.
| Cat |
52 |
\(180-52=128\) |
180 |
| No Cat |
\(95-52=43\) |
\(155-128=27\)
or
\(70-43=27\)
|
\(250-180=70\) |
| Total |
95 |
\(250-95=155\) |
250 |
Now that we have our contingency table completed, notice that the numbers in the central four cells add to the grand total as shown in the table on the left. The total row and the total column also add to the grand total as shown in the right table.
| Cat |
52 |
128 |
180 |
| No Cat |
43 |
27 |
70 |
| Total |
95 |
155 |
250 |
| Cat |
52 |
128 |
180 |
| No Cat |
43 |
27 |
70 |
| Total |
95 |
155 |
250 |
We can use contingency tables to find probabilities involving "and" and "or". Note, for example that there are 52 respondents out of the grand total 250 who own both a cat and a dog. So, the probability that a respondent selected at random has both a dog and a cat is
\begin{equation*}
P(D \cap C)=\frac{52}{250}=20.8\%
\end{equation*}
where \(D\) is the event that the respondent owns a dog and \(C\) is the event that the respondent owns a cat.
Similarly, the probability that a respondent owns a cat or a dog is
\begin{equation*}
P(D \cup D)=\frac{52+128+43}{250}=\frac{223}{250}=89.2\%.
\end{equation*}
Example 5.1.11.
The contingency table shows the survival data for passengers and crew aboard the Titanic.
| Survive |
203 |
118 |
178 |
212 |
711 |
| Not Survive |
122 |
167 |
528 |
673 |
1490 |
| Total |
325 |
285 |
706 |
885 |
2201 |
What percent of people aboard the Titanic did not survive?
What percent of the people aboard the Titanic were members of the crew?
What is the probability that a person selected at random from the ship’s manifest (list of all aboard) is a first class passenger who survived?
What is the probability that a person selected at random from the ship’s manifest was a first class passenger or survived?
Solution.
A total of 1490 out of the 2201 people aboard did not survive. That is \(\frac{1490}{2201}\approx67.7\%\) of those aboard who lost their lives.
There were 885 crew, which is \(\frac{885}{2201}\approx 37.9\%\)
Of the 2201 people aboard, 203 were first class passengers who survived. The resulting probability is
\begin{equation*}
(\text{first class}\cap \text{survived})\frac{203}{2201}\approx 9.2\%.
\end{equation*}
-
Putting together the 711 survivors plus the remaining 122 first class passengers who did not survive gives us a total of 833 people who were first class or survived. Another approach to find this total is to add all the values, excluding totals, in the survive row and the first class column to get \(203+122+118+178+212=833\) people who were first class or survivors or both.
Therefore, the probability is
\begin{equation*}
P(\text{first class}\cup \text{survived})=\frac{833}{2201}\approx 37.8\%.
\end{equation*}
Subsection 5.1.4 Complementary Events
In the previous example, we found that 74% of students at a particular college are eligible for an outreach program. We could quickly determine the percentage of students who are not eligible by subtracting from 100% to find that 36% are not eligible.
The two events, "being eligible for the program" and "not being eligible for the program", are complementary, meaning that together they complete the full list or full complement of possible outcomes. For two events to be complementary, it is also necessary that they cannot occur at the same time.
We will see situations later in this chapter where it is significantly easier to calculate the probability that something doesn’t happen than the probability that it does. We will use the strategy of first finding the probability that the event doesn’t happen and then subtracting from one or 100%.
Example 5.1.12.
Find the probability of getting a sum of less than 11 when rolling two dice.
Solution.
Looking at the table in
Assemblage , we see that there are three ways to obtain a sum of 11 or higher, which is the complement of the event we are interested in. This means that there must be
\(36-3=33\) ways to obtain a sum less than 11.
Therefore
\begin{equation*}
P(\text{sum}\lt 11)=\frac{33}{36}=\frac{11}{12}.
\end{equation*}
Note that this computation is equivalent to
\begin{equation*}
P(\text{sum}\lt 11)=1-\frac{3}{36}
\end{equation*}
because \(1=\frac{36}{36}\text{.}\)
Complementary Events.
The commplement of event \(E\text{,}\) written \(\overline{E}\) is the event that \(E\) does not happen.
We read \(\overline{E}\) as "\(E\) bar" or "not \(E\)".
\begin{equation*}
P(\overline{E})=\frac{\text{Number of outcomes that do not correspond to }E}{\text{Total Outcomes}}
\end{equation*}
or
\begin{equation*}
P(\overline{E})=\frac{\text{Total Outcomes }-\text{ Outcomes in E}}{\text{Total Outcomes}}.
\end{equation*}
In mathematical terms, we have:
\begin{equation*}
P(\overline{E})=1-P(E)
\end{equation*}
and
\begin{equation*}
P(E)=1-P(\overline{E}).
\end{equation*}
Example 5.1.13.
If you draw a card at random from a standard deck, what is the probability that it is not a diamond?
Solution.
The probability that the card is a diamond is \(\frac{13}{52}=0.25\text{.}\)
Thus the probability that the card is not a diamond is \(1-0.25=0.75\text{.}\)
We often use complements as a tool to make calculations easier as seen in the next example.
Example 5.1.14.
There are 20 marbles in a bag. Two are green, three are yellow, five are blue, seven are white, and three are black. If one marble is drawn from the bag at random, what is the probability that is is yellow, blue, white, or black?
Solution.
We could add up all the yellow, blue, white, and black marbles, but it’s much easier to note that we are looking for everything except the two green marbles. Therefore, the probability is:
\begin{equation*}
P(\text{yellow, blue, white or black})=\frac{20-2}{20}=\frac{18}{20}=0.9
\end{equation*}
We also could use the formula that \(P(E)=1-P(\overline{E})\) and calculate:
\begin{equation*}
P(\text{yellow, blue, white or black})=1-P(\text{green})=1-\frac{2}{20}=0.9
\end{equation*}
When comparing the two approaches shown in the example above, the first approach is often simpler to understand. However, when we get into some of the more advanced applications later in this chapter, the second approach will be more useful.