Subsection D.2 Using Graphs to Solve Problems
Graphing technology can be used to evaluate functions and solve equations.
Evaluate a Function: Once the function has been defined by entering it on an expression line, put your curson in a new expression line and enter your calcuation in function notation. For example, if you have defined \(P_1(t)=100+20t\text{,}\) you can type \(P_1(4)\) and hit Enter to find that value.
Solve an Equation: Solutions to equations are represented graphically by intersection points. If you are solving an equation of the form \(f(x)=g(x)\text{,}\) the solutions are the x-coordinates of the points where the graphs of \(y=f(x)\) and \(y=g(x)\) intersect.
Example D.2.12. Fish population.
The population of an invasive fish species in a pond follows the logistic growth function \(P(t)=\frac{200}{1+25e^{-0.04t}}\) where \(P\) is the number of fish in the pond at time \(t\) in months after a few of the fish were accidentally introduced into the ecosystem.
Find the population after 10 months.
After how many months will the population reach 100 fish?
Solution.
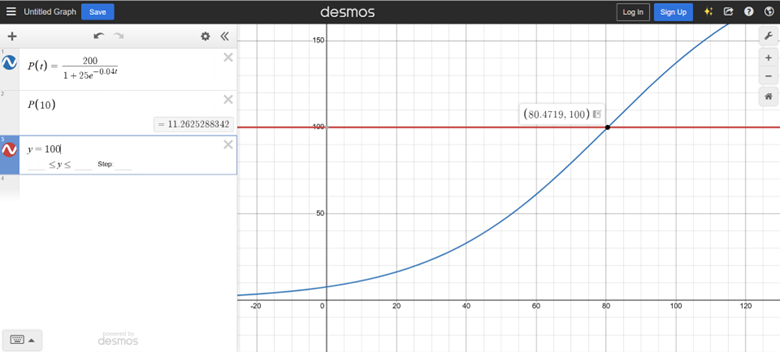
To find the population after 10 months, we need to evaluate \(P(10)\text{.}\) (We know that because 10 years is a time, which is a \(t\) value; we are replacing \(t\) with 10. In Desmos, we enter \(P(t)=\frac{200}{1+25e^{-0.04t}}\) on an expression line and hit Enter. On the next expression line, or any available expression line, we type \(P(10)\) and hit Enter. The value 11.2625288342 appears. Rounding to the nearest whole fish, we conclude that there were about 11 fish in the pond after 10 months.
To determine how many months it will take the population to reach 100 fish, we will solve the equation \(P(t)=100\text{.}\) (We know to do this because 100 is a number of fish, which is a \(P\) value, so we are replacing the output with 100. That is found by determining where the graphs of \(y=P(t)\) and \(y=100\) intersect. We already have the graph of \(y=P(t)\) displayed from the previous part of this example. On a new expression line, we input \(y=100\) and adjust the viewing rectangle in the graph until we can see where the two graphs intersect. Clicking on the intersection point brings up the coordinates of the point, \((80.4719.100)\text{.}\) Recall that we are looking for the time, or \(t\) value, which is about \(80.5\) months.
Example D.2.13. Projectile Motion.
The function \(h(t)=-16t^{2}+64t+5\) models the height \(h\) in feet of a pumpkin at time \(t\) seconds after it is launched from a trebuchet. Use graphing technology to determine the following:
Find the initial height of the pumpkin.
Find the height of the pumpkin after \(3\) seconds.
After how many seconds does the pumpkin reach its maximum height, and what is the maximum height?
After how many seconds does the pumpkin land on the ground, which is a height of \(0\) feet?
Solution.
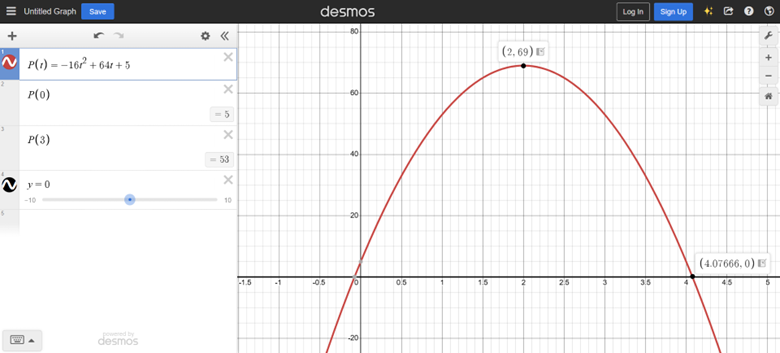
We begin by creating a graph of the function and the line \(y=0\text{;}\) then we adjust the viewing rectange to show the maximum height and the intercepts.
Now we can use the graph to answer the questions.
The initial height of the pumpkin is \(P(0)=5\) feet above the ground.
After 3 seconds, the pumpkin is at a height of \(P(3)=53\) feet above the ground.
The highest point on the graph corresponds to its maximum. The coordinates of this point are \((2,69)\text{.}\) The x-coordinate is the time, so we can say that the pumpkin reaches its maximum height after 2 seconds. The y-coordinate is the height, so we can say that the maximum height is 69 feet.
The time when the pumpkin lands on the ground is the x-coordinate of one of the points where the graph intersects the line \(y=0\text{,}\) which is the x-axis. This is because the height of the ground is 0 feet. There are two such points, but we may disregard the point with a negative x-value since we are not going backward in time. Therefore, the time when it lands is \(x=4.07666\) seconds.
Example D.2.14. Home Value.
A home was purchased for $350,000 in 2016. If home values in the area have been increasing by 9% per year according to an exponential model, when will the home be worth $1,000,000?
Solution.
For simplicity, we will measure time \(t\) in years since 2012 and the value \(P(t)\) will be measured in thousands of dollars.
Using an exponential model of the form \(P(t)=P_0\left(1+r\right)^{t}\) with \(P_0=350\) and \(r=0.09\text{,}\) we obtain the function
\begin{equation*}
P(t)=350\left(1.09\right)^{t}\text{.}
\end{equation*}
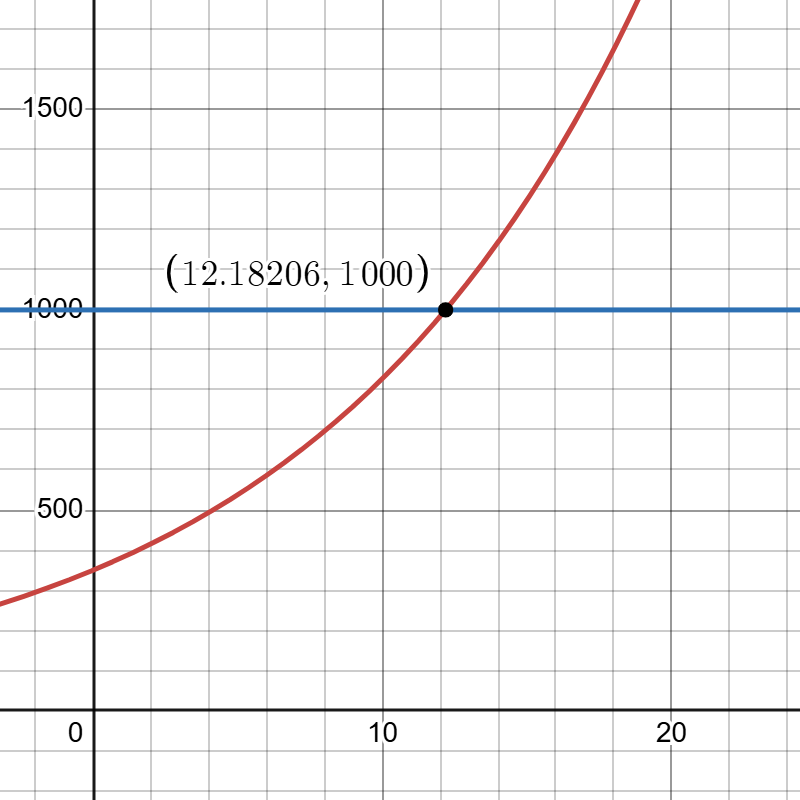
The time when the value reaches $1,000,000 is the solution to the equation \(P(t)=1000\text{.}\) To find this solution, we will graph \(y=P(t)\) and \(y=1000\text{;}\) then find where the graphs intersect.
The two functions intersect where \(t=12.18206\) which is the year \(2016+12=2028\text{.}\) Therefore, the home will be worth $1,000,000 in the year 2028.